
DataCo Supply Chain Optimization Diagnostic: Late Deliveries, Status Chaos & Profit Signal Contamination

Technical Documentation
- Power BI interactive dashboard
- DAX measures and data model
- Python PANDAS scripts run initially for data cleaning
Client Background
DataCo Global is a high-volume logistics and supply chain operator managing end-to-end fulfillment, warehousing, multimodal shipping, and logistics across 117 SKUs for retail partners and direct-to-consumer channels.
The operation processes over 180,000 transactions with substantial revenue, yet is bleeding heavily from chronically late deliveries, aged-stuck orders, and inefficient logistics. These failures are not minor inefficiencies, they potentially represent millions in preventable loss and operational drag.
Reporting directly to the Head of Site Operations, this diagnostic was performed to expose hidden waste, quantify failures, and identify immediately actionable fixes to inventory accuracy, processes, and supply chain execution.
Northstar Metrics
- Profit Leak & Waste Recovery
Apparent vs. reconstructed loss to expose data quality issues and discount-driven distortion. - Delivery Reliability & Escalation Gaps
Late delivery rates by shipping mode and escalation triggers to surface execution failures. - Capital Tie-Up & Risk Exposure
Aged-stuck orders (>90 days) and status chaos creating secondary waste/fraud vectors.
Executive Summary
Raw analysis of 180,519 orders using the original “Benefit per order” field showed $3.88 million in profit leakage across 33,784 loss-making orders (18.71% of total volume).
Because the dataset deliberately omitted the true unit cost column, I reconstructed a stable Estimated Unit Cost using the median Order Item Profit Ratio per product + a realistic 40% gross margin fallback on items with low sales volume. Applying this baseline row-by-row revealed the original profit signal was almost entirely false. Only 79 orders across the entire 180k-order dataset were truly unprofitable, with total estimated loss collapsing to approximately $900.
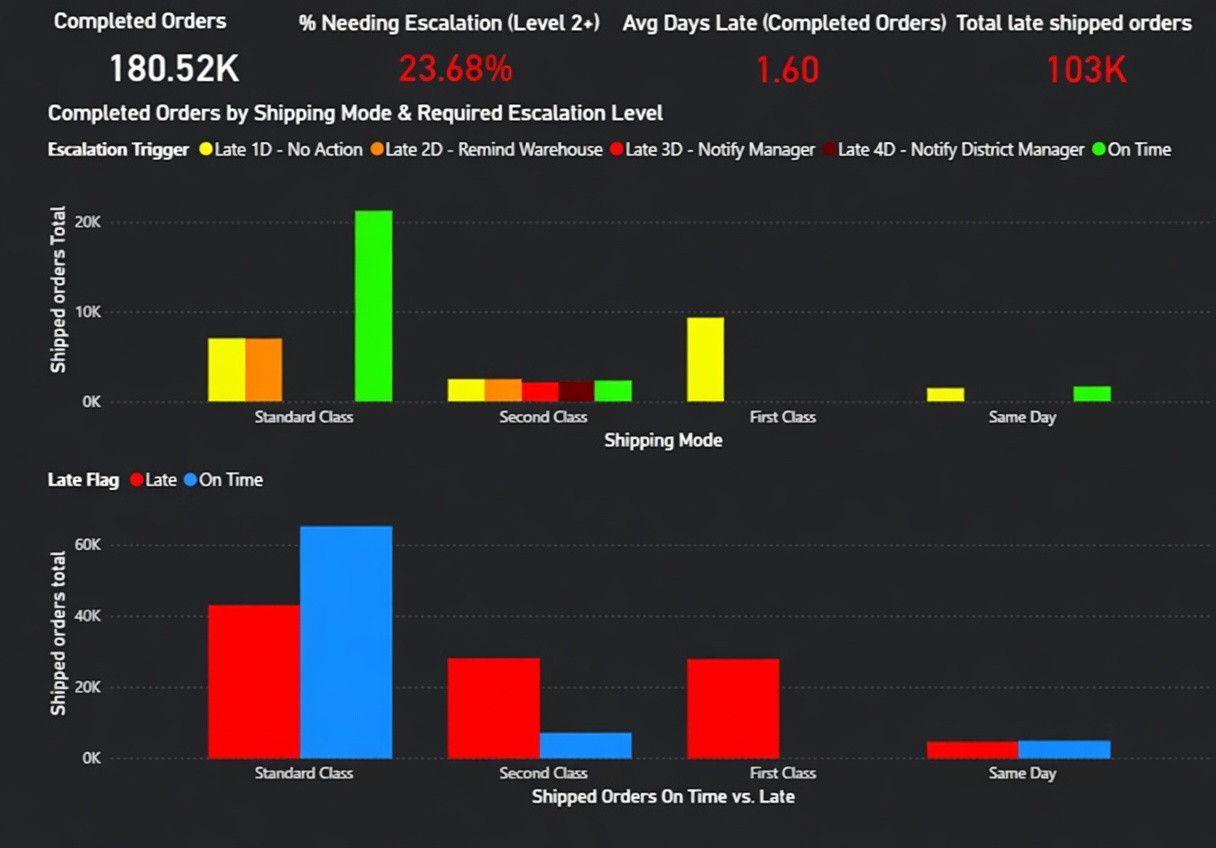
Delivery performance is severely degraded. Overall late delivery risk is 54.83%, with First Class failing at 95%+. 180,520 shipped orders carried late flags, a substantial portion falling into the 2–4 day escalation window.
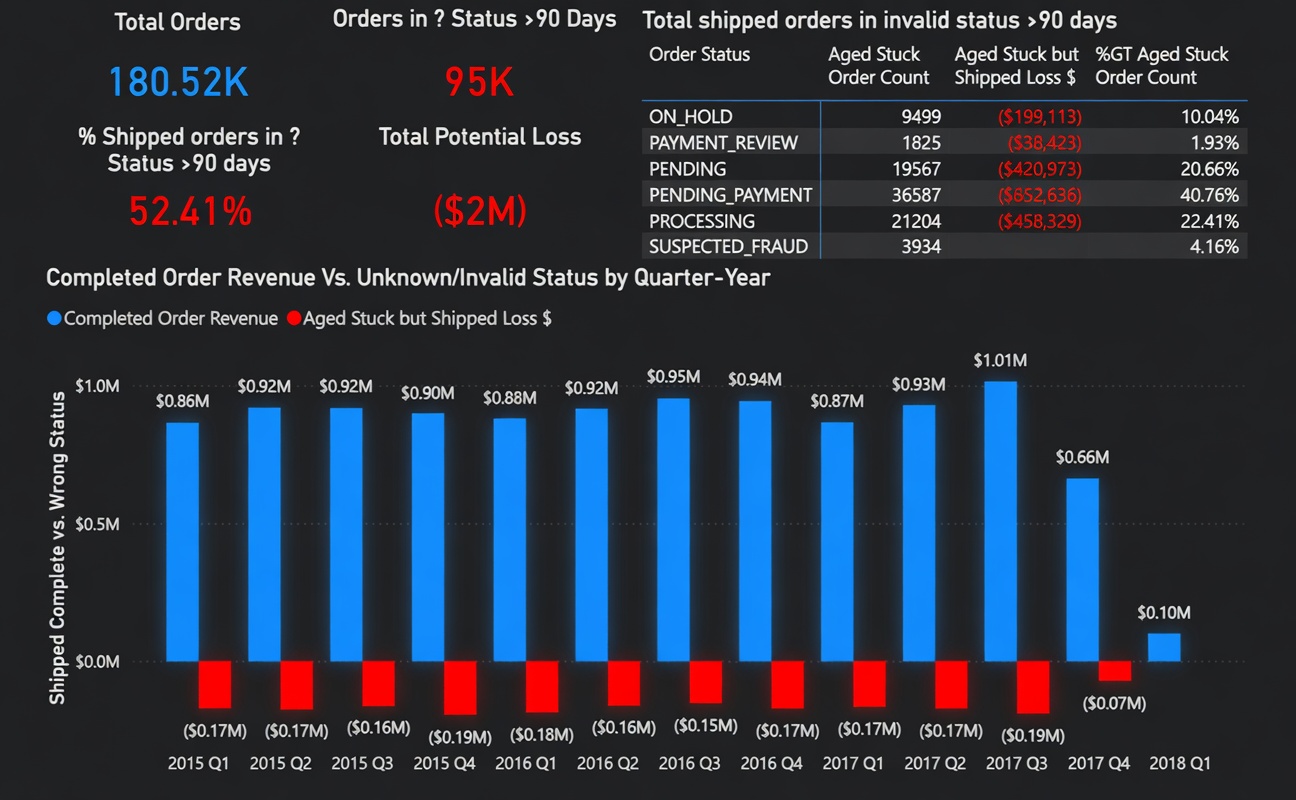
95,000+ orders remain aged-stuck (>90 days in pending, on-hold, or suspected fraud statuses), locking up $2.05 million in realized loss, with 93%+ of invalid-status value turning into permanent bleed. Order status chaos prevents accurate loss attribution and creates ongoing waste and fraud exposure.
These patterns expose systemic failures in pricing/discount controls, fulfillment execution, and status management, failures that turn high-volume operations into sustained multimillion-dollar leaks.
Stakeholder Report & Key Findings
Client Background
DataCo Global is a high-volume logistics and supply chain operator managing end-to-end fulfillment, warehousing, multimodal shipping, and logistics across 117 SKUs for retail partners and direct-to-consumer channels.
The operation processes over 180,000 transactions with substantial revenue, yet is bleeding heavily from chronically late deliveries, aged-stuck orders, and inefficient logistics. These failures are not minor inefficiencies, they potentially represent millions in preventable loss and operational drag.
Reporting directly to the Head of Site Operations, this diagnostic was performed to expose hidden waste, quantify failures, and identify immediately actionable fixes to inventory accuracy, processes, and supply chain execution.
Section heading
- Profit Leak & Waste Recovery
Apparent vs. reconstructed loss to expose data quality issues and discount-driven distortion. - Delivery Reliability & Escalation Gaps
Late delivery rates by shipping mode and escalation triggers to surface execution failures. - Capital Tie-Up & Risk Exposure
Aged-stuck orders (>90 days) and status chaos creating secondary waste/fraud vectors.
Raw analysis of 180,519 orders using the original “Benefit per order” field showed $3.88 million in profit leakage across 33,784 loss-making orders (18.71% of total volume).
Because the dataset deliberately omitted the true unit cost column, I reconstructed a stable Estimated Unit Cost using the median Order Item Profit Ratio per product + a realistic 40% gross margin fallback on items with low sales volume. Applying this baseline row-by-row revealed the original profit signal was almost entirely false. Only 79 orders across the entire 180k-order dataset were truly unprofitable, with total estimated loss collapsing to approximately $900.
Delivery performance is severely degraded. Overall late delivery risk is 54.83%, with First Class failing at 95%+. 180,520 shipped orders carried late flags, a substantial portion falling into the 2–4 day escalation window.
95,000+ orders remain aged-stuck (>90 days in pending, on-hold, or suspected fraud statuses), locking up $2.05 million in realized loss, with 93%+ of invalid-status value turning into permanent bleed. Order status chaos prevents accurate loss attribution and creates ongoing waste and fraud exposure.
These patterns expose systemic failures in pricing/discount controls, fulfillment execution, and status management, failures that turn high-volume operations into sustained multimillion-dollar leaks.
Core Findings: Profit, Delivery & Status Failures
Data Quality Warning
Critical Status Chaos - The Core Operational Failure 19% of orders remain in non-final statuses after 90 days, locking up $2.05M in realized but untracked loss. Because the data model is blind, we cannot distinguish between paid/shipped orders and actual fraud or waste, turning this into a massive, hidden leak. This is the main pain point. Without reliable, timely order status updates, no accurate loss attribution is possible, no root-cause analysis can be performed, and no meaningful corrective action can be designed or measured. The data model itself is blind. Money leaves the building while the system still believes the order is "pending," "on hold," or "suspected fraud." This status dysfunction creates secondary waste vectors and fraud exposure.
Delivery Performance & Escalation Gaps
- Massive Late Delivery Failure Across the Board
Out of 180,520 shipped orders, 54.83% carried a late flag. Average days late on completed orders is 1.60, with a maximum of 4 days observed. This is not occasional slippage, it is systemic execution breakdown. - First Class Is a Catastrophic Failure
First Class shipping, the premium/fastest mode, fails at over 95% late. It triggers the highest volume of escalation actions despite carrying lower total volume than Standard Class. This single mode alone destroys customer trust and inflates operational cost. - 23.68% of All Orders Require 2–4 Day Escalation
A full 23.68% of shipped orders fall into the 2–4 day late window, requiring warehouse reminders through district manager escalation. Standard Class and Second Class dominate this bucket, showing that even the highest-volume modes cannot maintain basic SLA performance. - On-Time Performance Is Concentrated in Low-Volume Modes
The majority of on-time shipments occur in Standard Class (by sheer volume), while First Class and Same Day show disproportionately poor reliability relative to their intended speed. The green “on time” bars are dwarfed by blue late bars in every mode except the lowest-volume ones. This pattern indicates fundamental capacity, process, or prioritization failures in fulfillment.
Profit Signal Reconstruction & Key Discovery
The original dataset contained no true unit cost column, forcing any profit analysis to rely on the provided “Benefit per order” field. This raw signal suggested $3.88 million in losses across 33,784 orders (18.71% of total volume).
To test the reliability of that signal, I reconstructed a stable Estimated Unit Cost using the median Order Item Profit Ratio per product, with a realistic 40% gross margin fallback for SKUs lacking sufficient history. I then calculated Estimated Profit per Order on a true row-by-row basis.
When using the new stable baseline, only 79 orders across the entire 180k-order dataset showed as truly unprofitable, with a total estimated loss collapsing to approximately $900.
The volatility chart provides visual proof. On a single high-volume product (Field & Stream Sportsman 16 Gun Fire Safe, ~70k orders), the implied unit cost swings wildly between ~$150 and ~$1,485 depending solely on the discount applied even though the underlying product is identical. This extreme instability exists across both high- and low-value items.
Key Takeaways & Recommendations
The analysis reveals two core systemic failures: a contaminated profit signal driven by extreme discount volatility, and chronic breakdowns in delivery execution and order status management. 19% of orders remain in non-final statuses after 90 days, locking up $2.05M in potential loss while blinding the operation to true waste and potential fraud.
Immediate action is required:
- Implement mandatory real-time order status updates
Require fulfillment teams to update every order to “payment received / cleared” before any shipment leaves the warehouse. No exceptions. This is the highest-priority fix. - Deploy a tiered escalation framework for late orders
2-day warehouse reminder / 3-day targeted manager notification / 4-day District Manager escalation. This targets the 23.68% of orders in the 2–4 day window. - Deprioritize or restrict First Class shipping for high-bleed categories
Immediately limit First Class for volatile categories (Fishing, Cleats, Camping & Hiking) to cut the 95%+ failure rate. - Introduce automated review or hard cancellation triggers for aged orders
Automatically flag or cancel orders stuck >30 days in pending, on-hold, or suspected fraud statuses to free working capital and clean the data model. - Enforce minimum margin guardrails on discounts
Block discounts that push high-volume SKUs below a defined profit threshold to prevent artificial losses. - Strengthen payment validation on bank transfers
Add stricter pre-authorization and fraud checks on bank transfer payments to reduce problematic cancellations and secondary waste.